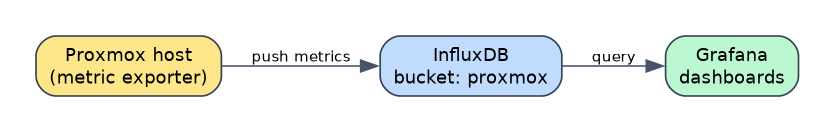
The pipeline
Metrics flow in one direction, from source to dashboard:
Proxmox host  --(built-in metric server)-->  InfluxDB  -->  Grafana
 (CPU, RAM,                                  (10.100.100.4)   dashboards
  disk, I/O)                                  bucket: proxmox  & alerts
                                                              -> monitoring.example.com
Proxmox has a built-in metric exporter — point it at an InfluxDB endpoint and it streams host (and VM) telemetry continuously. InfluxDB stores it as time series in a bucket. Grafana reads from InfluxDB and turns it into dashboards, published at https://monitoring.example.com.
This is the canonical shape of a metrics system: a source emits numbers, a time-series database stores them efficiently, and a visualisation layer makes them human. Swap InfluxDB for Prometheus and the shape is identical — which is the point of learning it this way.
Why we use this: the source → TSDB → dashboard pattern is universal. Once it clicks here, every other metrics stack (Prometheus + Grafana, cloud monitoring, etc.) is just a variation on the same three boxes.
Diagram
No comments to display
No comments to display